CPI Report – June 2009
The AUSTRALIAN BUREAU OF STATISTICS has recently released the Consumer Price Index data for the June 2009 quarter. Following is a summary of the information.
THE Consumer Price Index (CPI) is regarded as Australia’s key measure of inflation. It is designed to provide a general measure of price inflation for the Australian household sector as a whole.
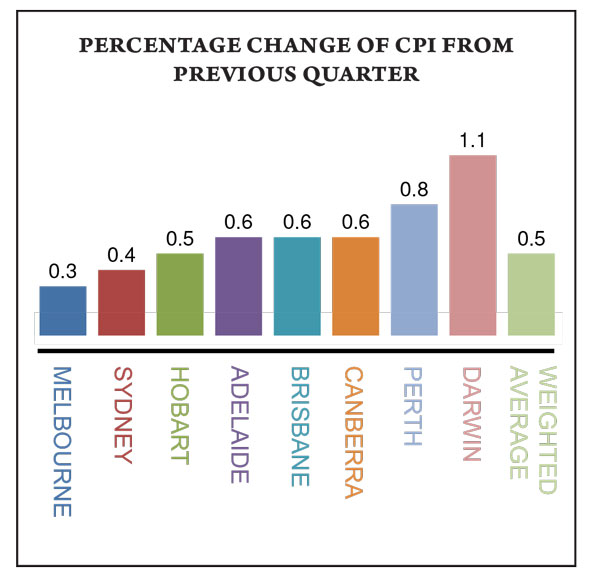
The CPI measures changes over time in the prices of a wide range of consumer goods and services acquired by Australian metropolitan households and it is published quarterly. At the “All Groups level”, the CPI rose in all capital cities this quarter.
Darwin registered the highest increase with a rise of 1.1%, while the remaining cities rose by between 0.3% and 0.8%.
Transportation, household contents and services and housing were the three main positive contributors in all cities except Hobart, where the contribution of the health group was higher than that for housing.
Price rises in the transportation group were driven by increases in automotive fuel prices in every capital city. This group was the largest positive contributor in both Melbourne and Perth.
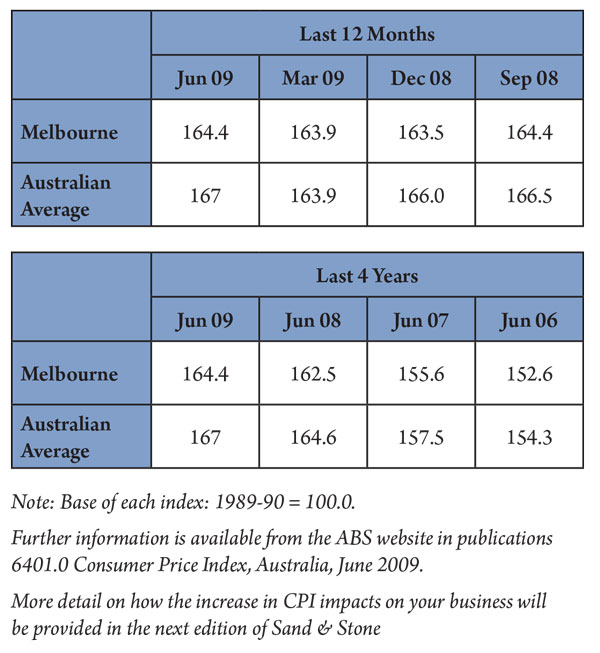
Over the twelve months to June quarter 2009, the All Groups CPI rose in all capital cities with the increases ranging from 1.2% in Melbourne to 2.5% in Darwin.
Movements in indexes from one period to another can be expressed as changes in index points or as percentage changes.

The following example illustrates the method of calculating changes in index points as a percentage change.
Melbourne June 2008 CPI Index Number 162.5
Melbourne June 2009 CPI Index Number 164.4
Percentage change = (164.4 – 162.5)/162.5 x 100 = 1.2%
Changes to the index numbers are summarised in the table below.


You must be logged in to post a comment Login