Construction Material Production Statistics
DR ELIZABETH GIBSON, General Manager of the CMPA.
Tables 1-10. In summary the annual reporting by the extractive industry may contain inaccuracies such as incorrect groupings; internal transfers distorting the rates which may bring into question the integrity of the data. Additionally, there may be concern by some around unrestricted access by Earth Resources Regulation officers to this highly commercially sensitive information. However, this information taking into account the below and the insert, is invaluable to the extractive industry and Government Departments.
Statistical Report data up to 2019/20
Table 1. Unit rate in $ versus tonnages of heavy construction material produced.

From the above chart it is seen that there has been a steady increase in heavy construction material tonnages from 2013-14, however, this has not been reflected in the average unit price despite increasing regulatory obligations.
Table 2. Basalt: Unit rate in $ versus tonnages of basalt produced.

Table 3. Granite: Unit rate in $ versus tonnages of granite produced.

Table 4. Hornfels: Unit rate in $ versus tonnages of hornfels produced.

Table 5. Sand & Gravel: Unit rate in $ versus tonnages of sand and gravel produced.

Table 6. Aggregate – Unit rate in $ versus tonnages of aggregate produced.

Table 7. Armour – Unit rate in $ versus tonnages of armour produced.

Table 8. Fill – Unit rate in $ versus tonnages of fill produced.

Table 9. Road base – Unit rate in $ versus tonnages of road base produced.

Table 10. Road sub-base – Unit rate in $ versus tonnages produced.

Table 11. Number of Work Authorities versus Rehabilitation Bonds.
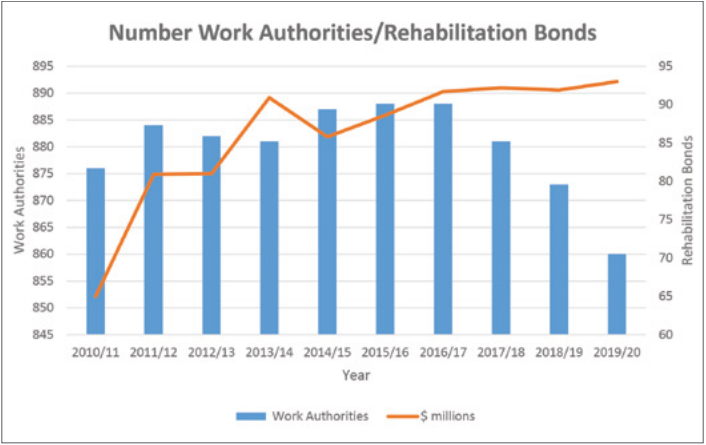
From the data in Table 11. above it can be seen that the magnitude increase of Rehabilitations Bonds from 2010/11 – 2019/20 is 43%. Additionally, notwithstanding a hold on rehabilitation bond increases by ERR from 2014/15 (apart from work plan variations) the total rehabilitation bond for the extractive industry has increased despite a decrease in the number of Work Authorities.
Table 12. Granted Extractive Industry Work Authorities (Greenfield applications).

Table 12. above demonstrates that replenishment of supply of heavy construction materials is not occurring and is in fact decreasing despite demand being at the highest rate ever 9.45 tonnes/per person/per annum in Victoria.
The information supplied here may be viewed at: https://earthresources.vic.gov.au/geology-exploration/maps-reports-data/geovic.
Table 13. Number of employees in the Extractive Industry versus year.

Table 13. above gives the number of employees in the Extractive Industry together with the % response rate. The apparent decrease in employees in the extractive industry (notwithstanding poor response rates) may be an indication of increased productivity. The data was taken from WorkSafe’s Health and safety statistics: Victorian mining exploration and extractive industries November 2020 available at:
https://www.worksafe.vic.gov.au/resources/health-and-safety-statistics-victorian-mining-exploration-and-extractive-industries.


You must be logged in to post a comment Login