Resources Victoria 2024/25 Annual Statistical Report
Dr Elizabeth Gibson, General Manager CMPA, provides an update on the Resources Victoria Statistical Report.
Resources Victoria (RV) recently released (December 2025) the 2024/25 Annual Statistical Report
A downturn for 2024/25 in annual construction material tonnages has occurred. This is due in part to reduced Government funding on roads maintenance. However, it was noted that RV had amended the tonnages for the previous four financial years (in comparison to figures shown in the relevant past statistical reports). Due to these amendments, published comparison figures for past rock type ($/tonne) cannot be presented with any accuracy.
*Sedimentary (usually rippable rocks, including sandstone, shale, siltstone, chert, mudstone, claystone).
Concrete sand** 9.17 186.37 20.32 (17.94)
(Product type)
*Concrete sand (product type) was included for information.
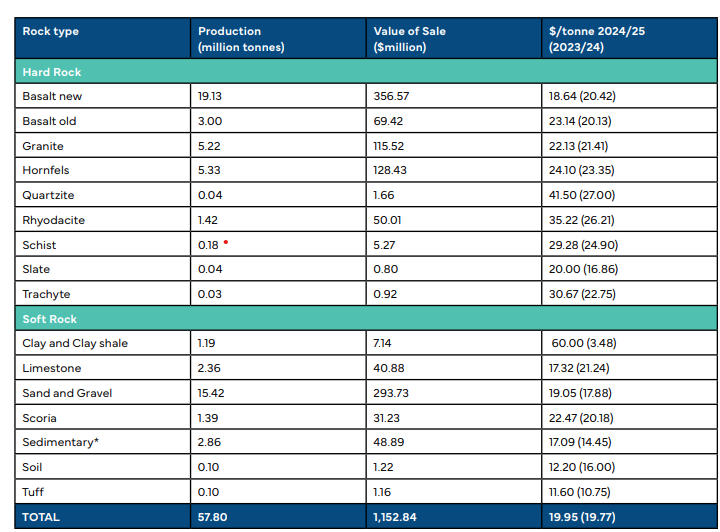
Figure 1 gives the production in tonnes; $ per tonne and projected tonnes of construction material against the financial year. It can be clearly seen that the:
- The Victorian Government Extractive Resources Supply and Demand Study 2015-2050 underestimated the future needs for construction material in Victoria by approximately 5% (3 million tonnes) for 2024/25.
- The average unit rate ($/tonne) has decreased by 2% indicating that there is a downturn in the residential and infrastructure industry in Victoria driven by a combination of high interest rates, elevated construction costs, labor shortages, and reduced public spending.
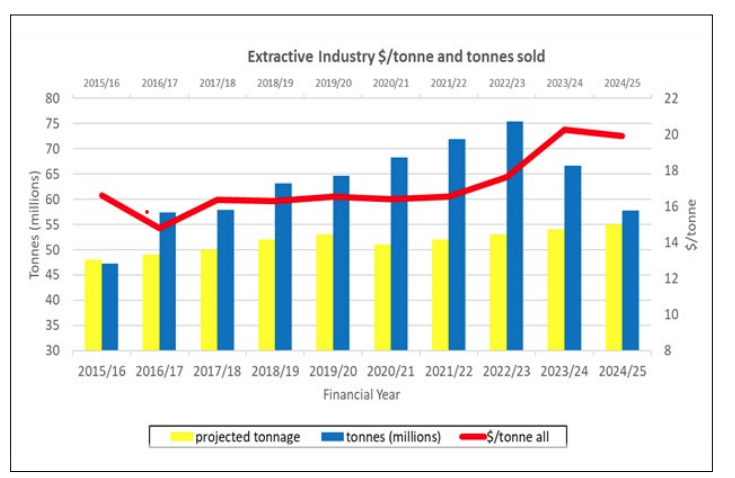
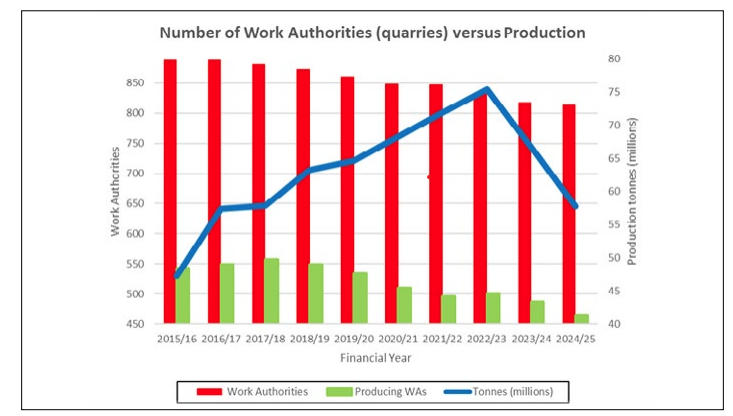
Figure 2 raises concerns that the total number of Work Authorities is declining. This becomes even more evident when considering only those Work Authorities actively producing construction material (green column). Not included in Figure 2 are the tonnages for the production of recycled construction and demolition waste which is approximately 6.5 million tonnes in Victoria (2019/20). Waste data reports
Figure 3 depicts the number of new Work Plans* submitted and the approvals pathway through Statutory Endorsement to approved Work Plan. Some that have been submitted may also be withdrawn by the proponent or refused by ERR. From 2017/18 to 2023/24 the number of approved Work Plans is generally low.
*Until the Work Authority (WA) is granted, an approved work plan does not provide security to the resource described in the Work Plan. Other government agencies may change their regulations etc. in the interim which until the WA is granted may still influence/change the Work Plan.
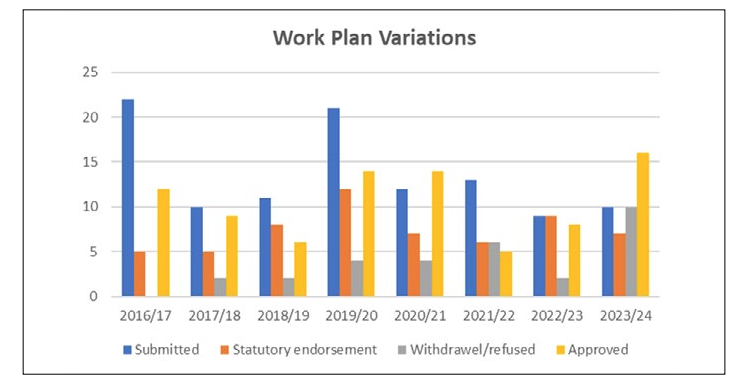
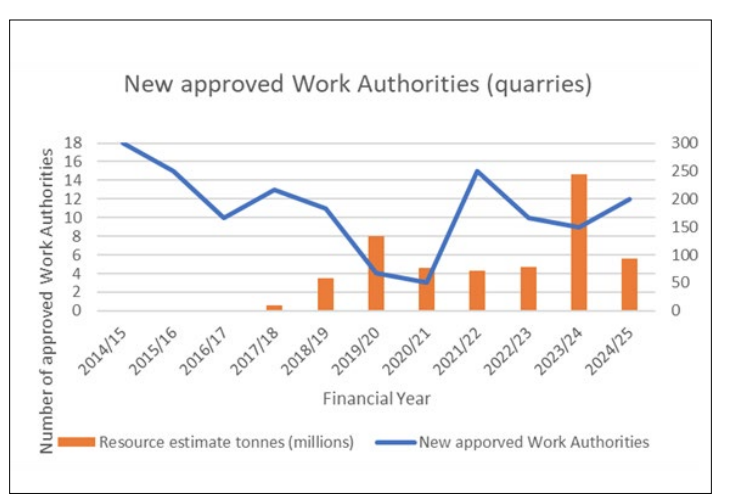
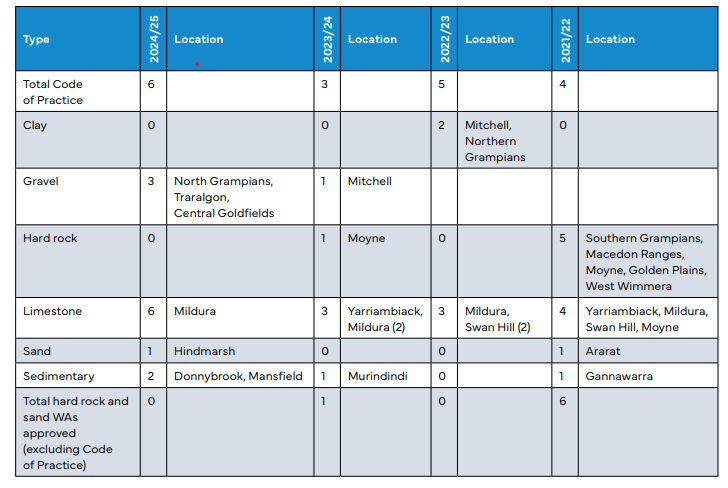
Table 2 gives a breakdown of the type of resource with a new approved Work Authority. Note the Code of Practice for small quarries resource type is not included which whilst essential for meeting local needs are small in size (<5 HA) and less than 5m deep. A number of the hard rock quarries approved in 2021/22 may be supplying wind farms and are also located far from the metropolitan Melbourne market (increased transport costs, wear on roads and carbon footprint). Note: No new hard rock (located close to metropolitan Melbourne) was approved in 2024/25.
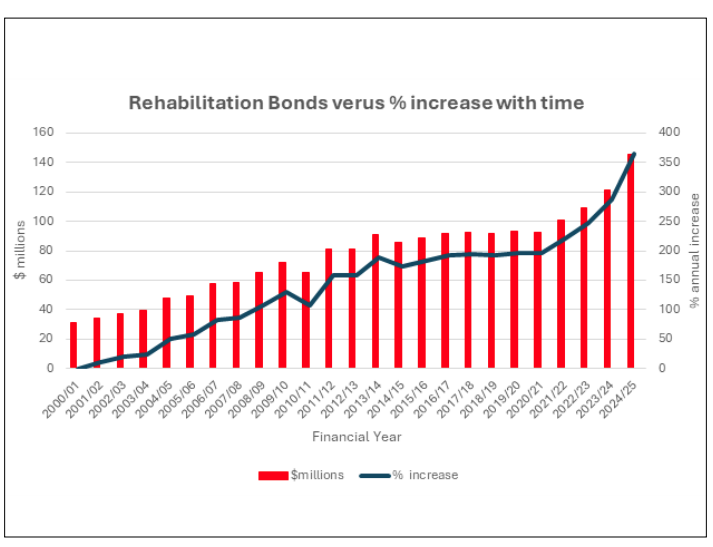
The steep increase in the rehabilitation bonds is due to ERR having modified the rehabilitation bond calculator in 2020/21. Some CMPA Members are experiencing unwarranted sharp increases (up to 4000% in some cases) in rehabilitation bonds that impact the financial viability of the operation. However, this appears to not have heavily impacted Mineral Licences (including coal mines): from 2016/17 to date the higher risk Mineral Licences have had an increase in 3% in rehabilitation bonds whilst Work Authorities over the same period have had a 59% increase.
The manner in which the rehabilitation bond calculator is applied by ERR is resulting in the disproportionate application of regulation leading to a distinct competitive advantage to Work Authority holders that have not had their bonds reviewed (currently the majority), and, hence, is an unreasonable regulatory process.
Further increases in construction material costs would result in (if this unreasonable regulatory process continues) dire implications for Victorian Government Major Projects and housing construction if these rehabilitation bond increases are applied across the industry.
There is no evidence of need for these increases given the good historical track record of the extractive industries with the Victorian Government having undertaken negligible rehabilitation of extractive industry sites over the past 25 years. Additionally, the majority of Work Authorities are undertaken through a business lease with the private landowner who benefits from the extractive industry activity.
As discussed in previous issues of Sand & Stone the CMPA is awaiting approval for the implementation by Resources Victoria of recommendations from the Government Panel – Rehabilitation Bonds Report 2025.


You must be logged in to post a comment Login